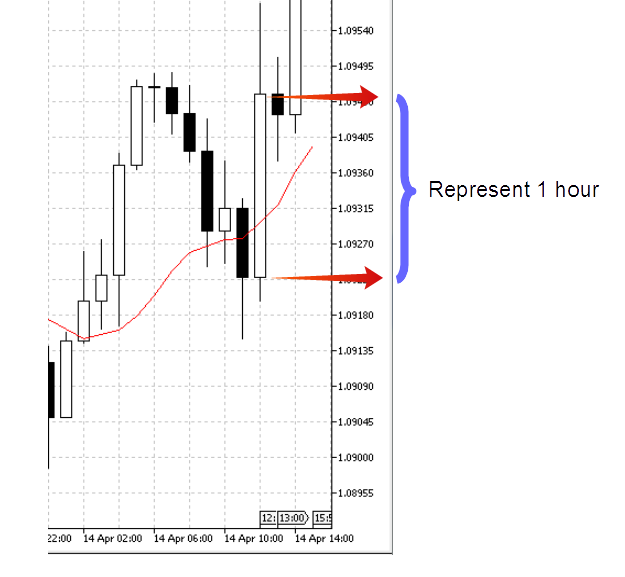
The chart shows data hourly and if you refer 24 hour chart, then there are 24 values. There are open value and the close value in the chart. The values will go up and down within the 24 hour time period. At a particular hour, the chart shows the exact value of the exchange rate of the currency pair. The Y axis of the chart represent the time period and the X axis show the exchange rate.
First you should set a larger time period to have a good understanding about the exchange rate of a particular pair. There are three types of charts and those are line charts, bar charts and candle stick charts. I would recommend you to follow the candlestick charts because it is user friendly and you can get an idea about the overall strength of the selected currency pair.
Metatrader 4 is the best Forex chart for beginners and professional traders. The special feature is that you can trade through the chart. This chart shows the data directly coming from the global market. You should know that the currency values are shown in four decimal places except for the Japan Yen which is shown in two decimal places.
Meta Trader 4
Login to your account and you can see a interface with 4 chart windows as below,

Select your chart window and maximize it

You can change the window as bar chart, candlestick or line chart.
Right click on the chart and change the time frame as you wish. The range is from 5 minutes to monthly. Each candlestick shows the time frame of the market price.
Example: If you select the H1 time frame, the candlestick shows the open and close of the market price within one hour.

Right click on the chart and use zoom in and out to make the chart more visible. Right click and go to properties to change the color scheme as you wish.

Select your chart window and maximize it

You can change the window as bar chart, candlestick or line chart.
Right click on the chart and change the time frame as you wish. The range is from 5 minutes to monthly. Each candlestick shows the time frame of the market price.
Example: If you select the H1 time frame, the candlestick shows the open and close of the market price within one hour.

Right click on the chart and use zoom in and out to make the chart more visible. Right click and go to properties to change the color scheme as you wish.


No comments:
Post a Comment